One dashboard instead of five open tabs at an agency
A marketing agency got a single view bringing together client budgets, payments, and overdue balances alongside deals and projects.
4 min read
- Client
- Marketing agency
- Industry
- Marketing / SaaS
- Scope
- Custom systems and API integrations
- Delivery time
- 3 weeks
Who the client was and what was getting in the way
A marketing agency handled sales and client service across several channels at once: LinkedIn outreach, email campaigns, clients’ search rankings, projects in ClickUp, and deals in HubSpot. Each tool did its job well. The problem was that there was nowhere to see them all together.
In practice, the team started each day by opening five tabs and switching between them. To find out where one client stood, someone had to check the CRM for the deal status, ClickUp for the project status, Search Console for results, and a spreadsheet to see whether the client had paid. Hours each day went just to switching context.
That led to tangible losses. Follow-up reminders got buried in email, and deals stalled because no single place flagged that a week had passed since the last conversation. Finances lived in Excel, so answering how much a client had paid and how much they still owed meant opening a spreadsheet and trusting that someone had updated it recently. The team also could not compare how many leads LinkedIn brought in against other channels without digging through reports by hand.
We considered off-the-shelf tools for gathering data from multiple sources, but they all fell short on one point: none handled the agency’s client billing. Budgets, payments, overdue balances, and summaries by NIP (Polish tax ID) are specific to this company, and that information needed to sit alongside search-ranking data. Simply connecting a data viewer would not solve the problem.
What we built
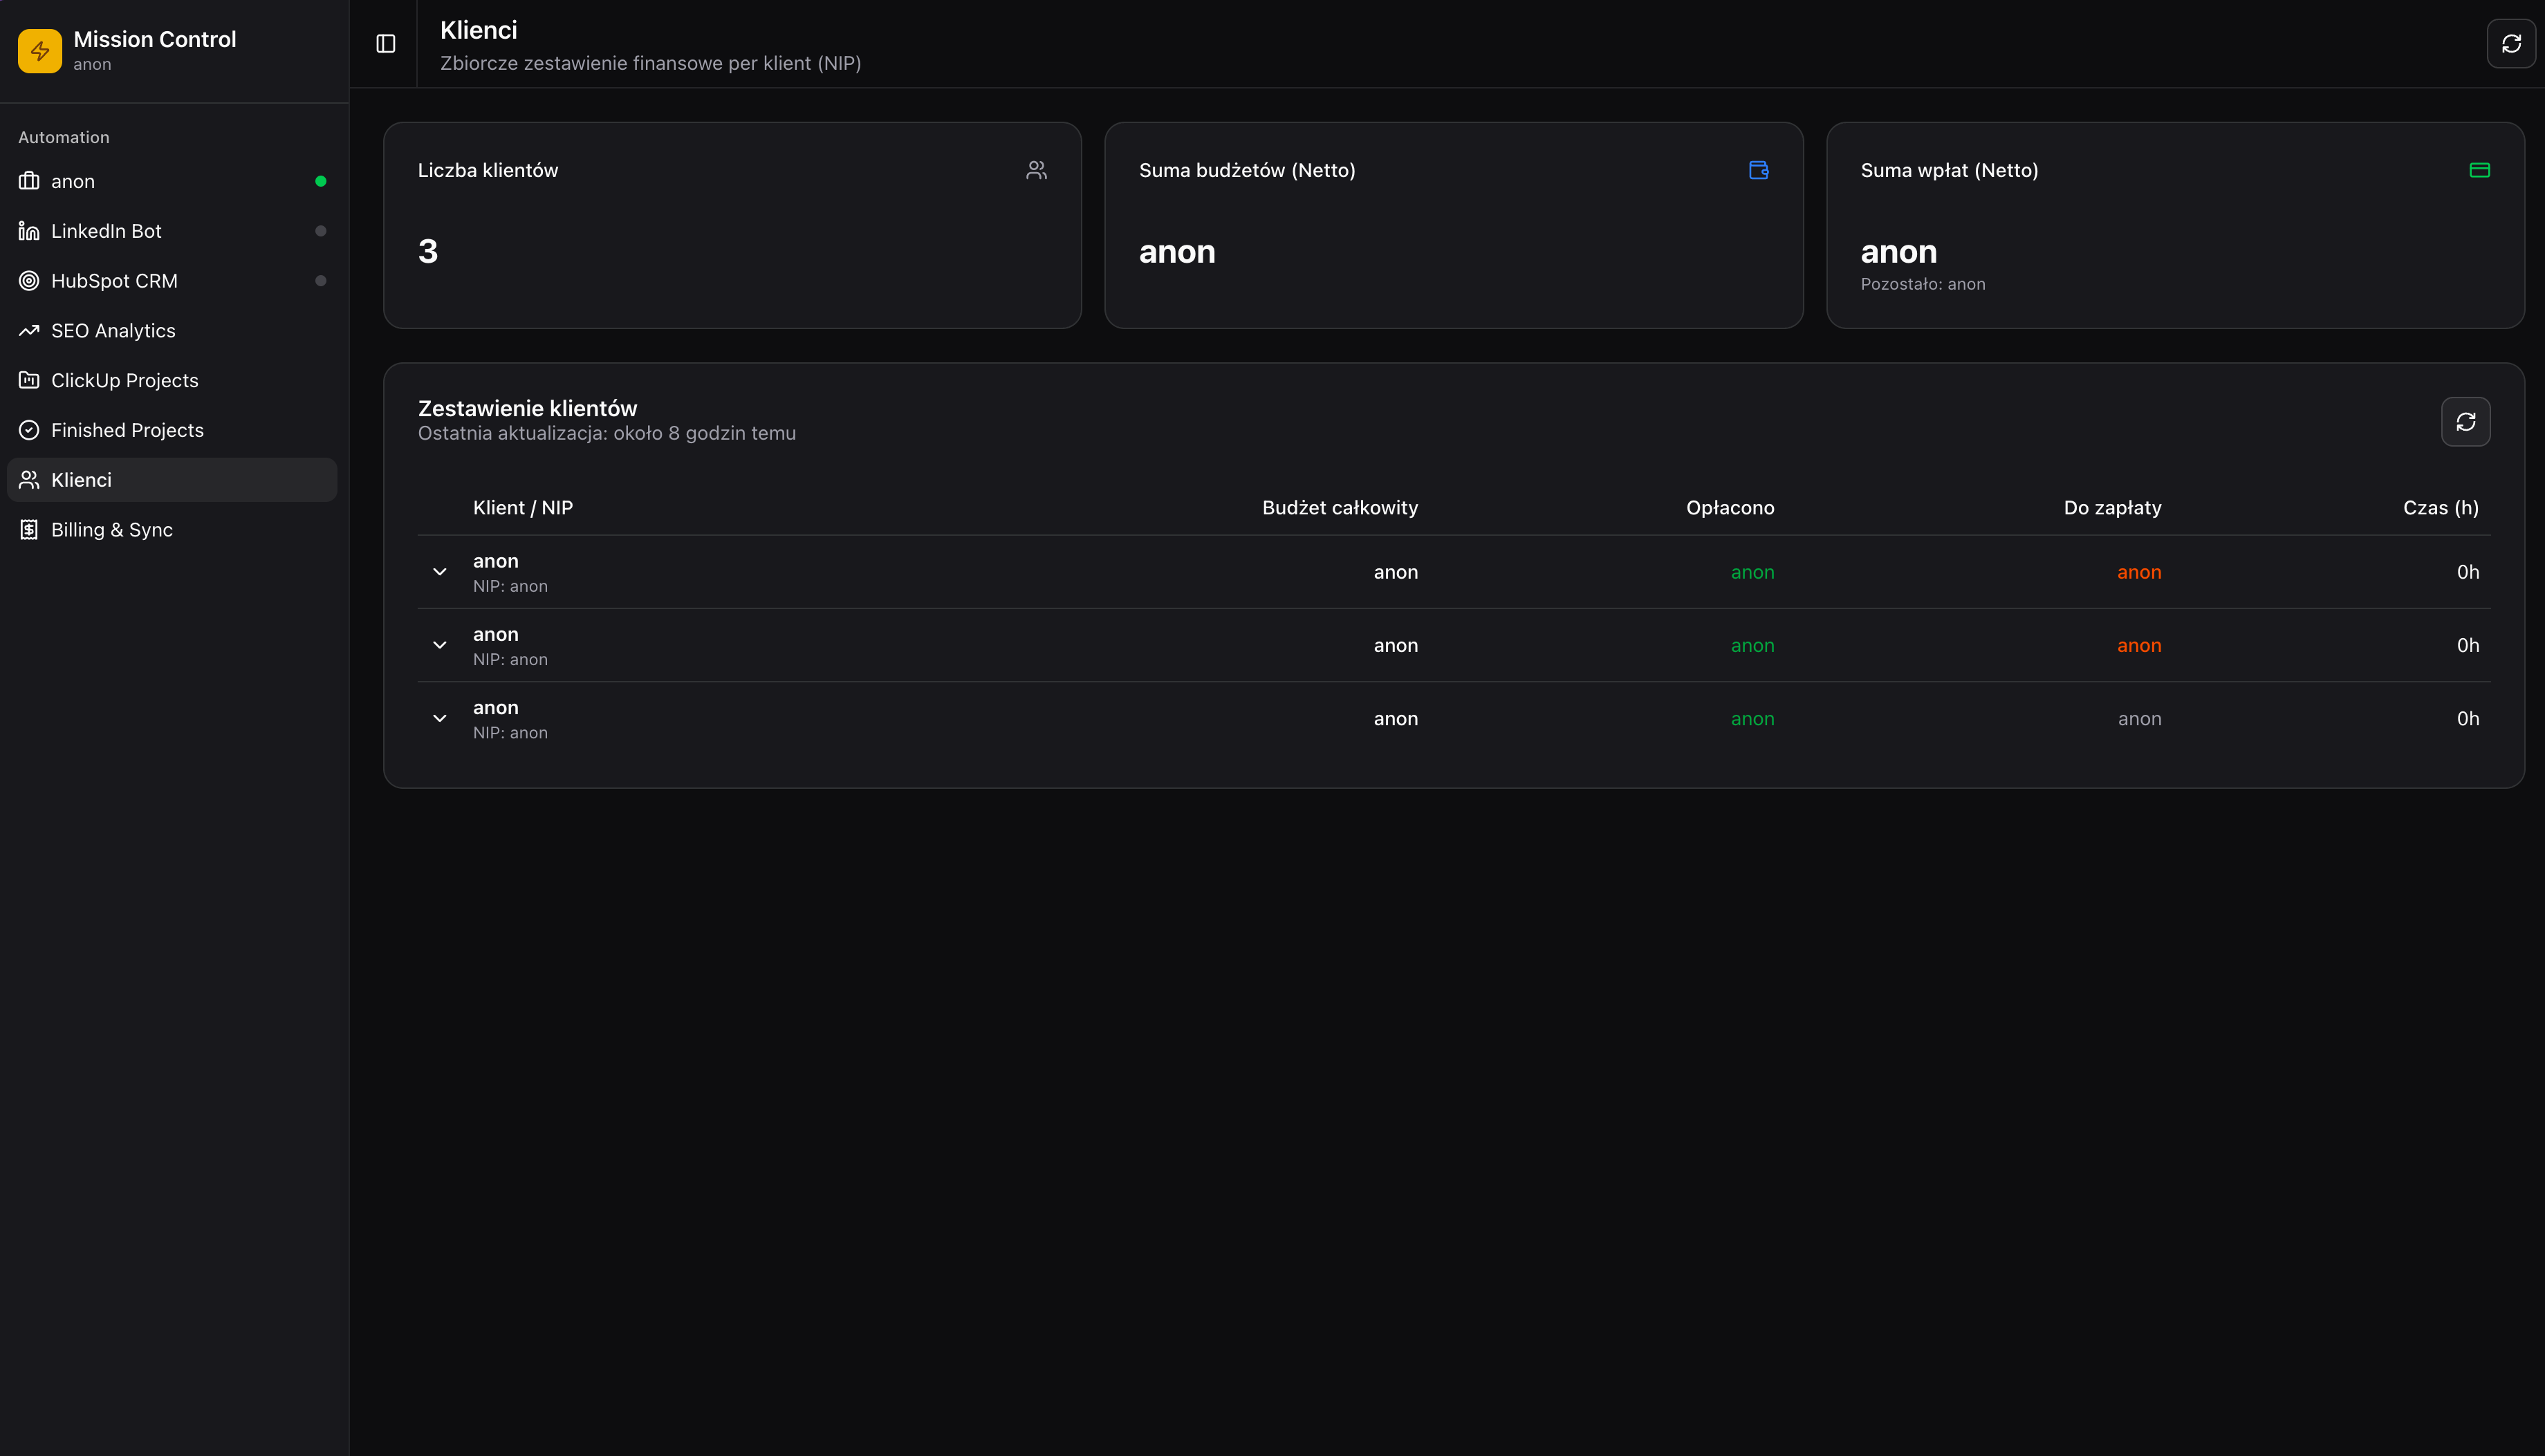
We built Mission Control, a dashboard that brings all these sources together in one view. We developed it in Next.js 14 with TypeScript, store the data in Supabase, and connected each external tool through its own interface.
We pull deals and reminders from HubSpot; project statuses, deadlines, and tasks from ClickUp; clients’ search rankings from Google Search Console; and outreach data from the LinkedIn contact platform. We also connected email automations and portals where the agency looks for work. One screen now shows what is happening with a client in sales, project delivery, and search performance.
We built a separate finance module because it was central to making the whole system useful. It stores client budgets, tracks payments and overdue balances, keeps summaries by NIP, generates invoices, and sends payment reminders. The client view therefore shows not only the status of a project, but also whether that client has paid.
The final layer is alerts. The dashboard reminds the team to follow up on deals, flags projects approaching their end date, and notifies them about new LinkedIn contacts. Instead of remembering to check, the team gets a signal when something needs attention.
How it works today
The project took three weeks. The first week went into reviewing how the team worked, mapping tool connections, and designing the dashboard architecture. The second was for building the main modules — clients, finance, projects, and automations — along with data synchronization. The third covered alerts, sales reports, exports, connection tests, and deployment.
Today, the team starts its day from one screen. Data from connected tools refreshes regularly, so the view does not need to be filled in by hand. Follow-up reminders and project alerts run automatically. Billing is calculated in the dashboard rather than in a spreadsheet.
The outcome
More than five tools were consolidated into one dashboard. There are more than five connected sources, including HubSpot, ClickUp, Google Search Console, and LinkedIn. Data syncs in real time, so the activity overview stays current without manual work. Follow-up reminders and project alerts are automated.
What we would do differently
API limits and differences in how each tool provides data took the most time. Every tool has its own pace, its own constraints, and its own idea of what counts as current. Next time, we will assume from the start that some data refreshes less often and explain that clearly in the interface, instead of promising a live view everywhere.
The second lesson was the finance module. We built it in the third phase, but it turned out to be the module the team uses most, so next time we will build it first. The third concerns alerts: the first version sent reminders too often, and people started ignoring them — which is worse than having no alerts at all.
Related projects
A dashboard that settles technicians’ accounts instead of an Excel spreadsheet
A field-service company with more than ten technicians stopped tallying cash, fuel, and parking by hand. Balances are calculated automatically.
China imports on one map, with customs documents alongside them
A logistics company can see every container in transit on one map, while the system flags missing documents before customs clearance.