A dashboard that settles technicians’ accounts instead of an Excel spreadsheet
A field-service company with more than ten technicians stopped tallying cash, fuel, and parking by hand. Balances are calculated automatically.
4 min read
- Client
- Field service company
- Industry
- Services / Field service
- Scope
- Custom systems and API integrations
- Delivery time
- 2 weeks
Who the client was and what was getting in the way
A field-service company handling electrical repairs and inspections. It had dozens of work orders a day and more than ten technicians in the field, each with their own route, jobs, and expenses. It is the kind of work that happens in a vehicle and at the customer’s site, not at a desk.
Administration relied on Excel, notes, and email. Settlements were the biggest problem. A technician collects some payments in cash, while customers pay others by bank transfer; along the way, the technician fills up, pays for parking, and buys materials. At the end, someone in the office had to add everything up by hand for each technician and calculate the balance. It took several hours a week, and mistakes were common. Those mistakes led to disputes over amounts — and a money dispute with someone who is driving to a customer the next day is the worst kind of operational problem.
The owner had no up-to-date view of the business. They did not know how much had come in that day in cash or by bank transfer, how many jobs were closed, or how many were still outstanding. Operating costs — fuel, parking, and materials — were not tracked consistently, so the margin on each job was a guess. Documents also went missing along the way: invoices, service reports, and inspection records were sometimes absent, and the team only found out when someone needed them.
We looked at ready-made field-service systems. They handle the job itself well: who did what, where, and when. But none tracked the cash balance between the company and an individual technician, including fuel and parking costs paid by that technician. That was exactly the part consuming time and causing conflict, so we built our own system.
What we built
We built a dashboard with two levels. It runs on Next.js 14 and TypeScript, stores data in Supabase, uses Tailwind CSS for its interface, and is hosted on Vercel. It is a simple stack because the challenge was settlement logic, not technology.
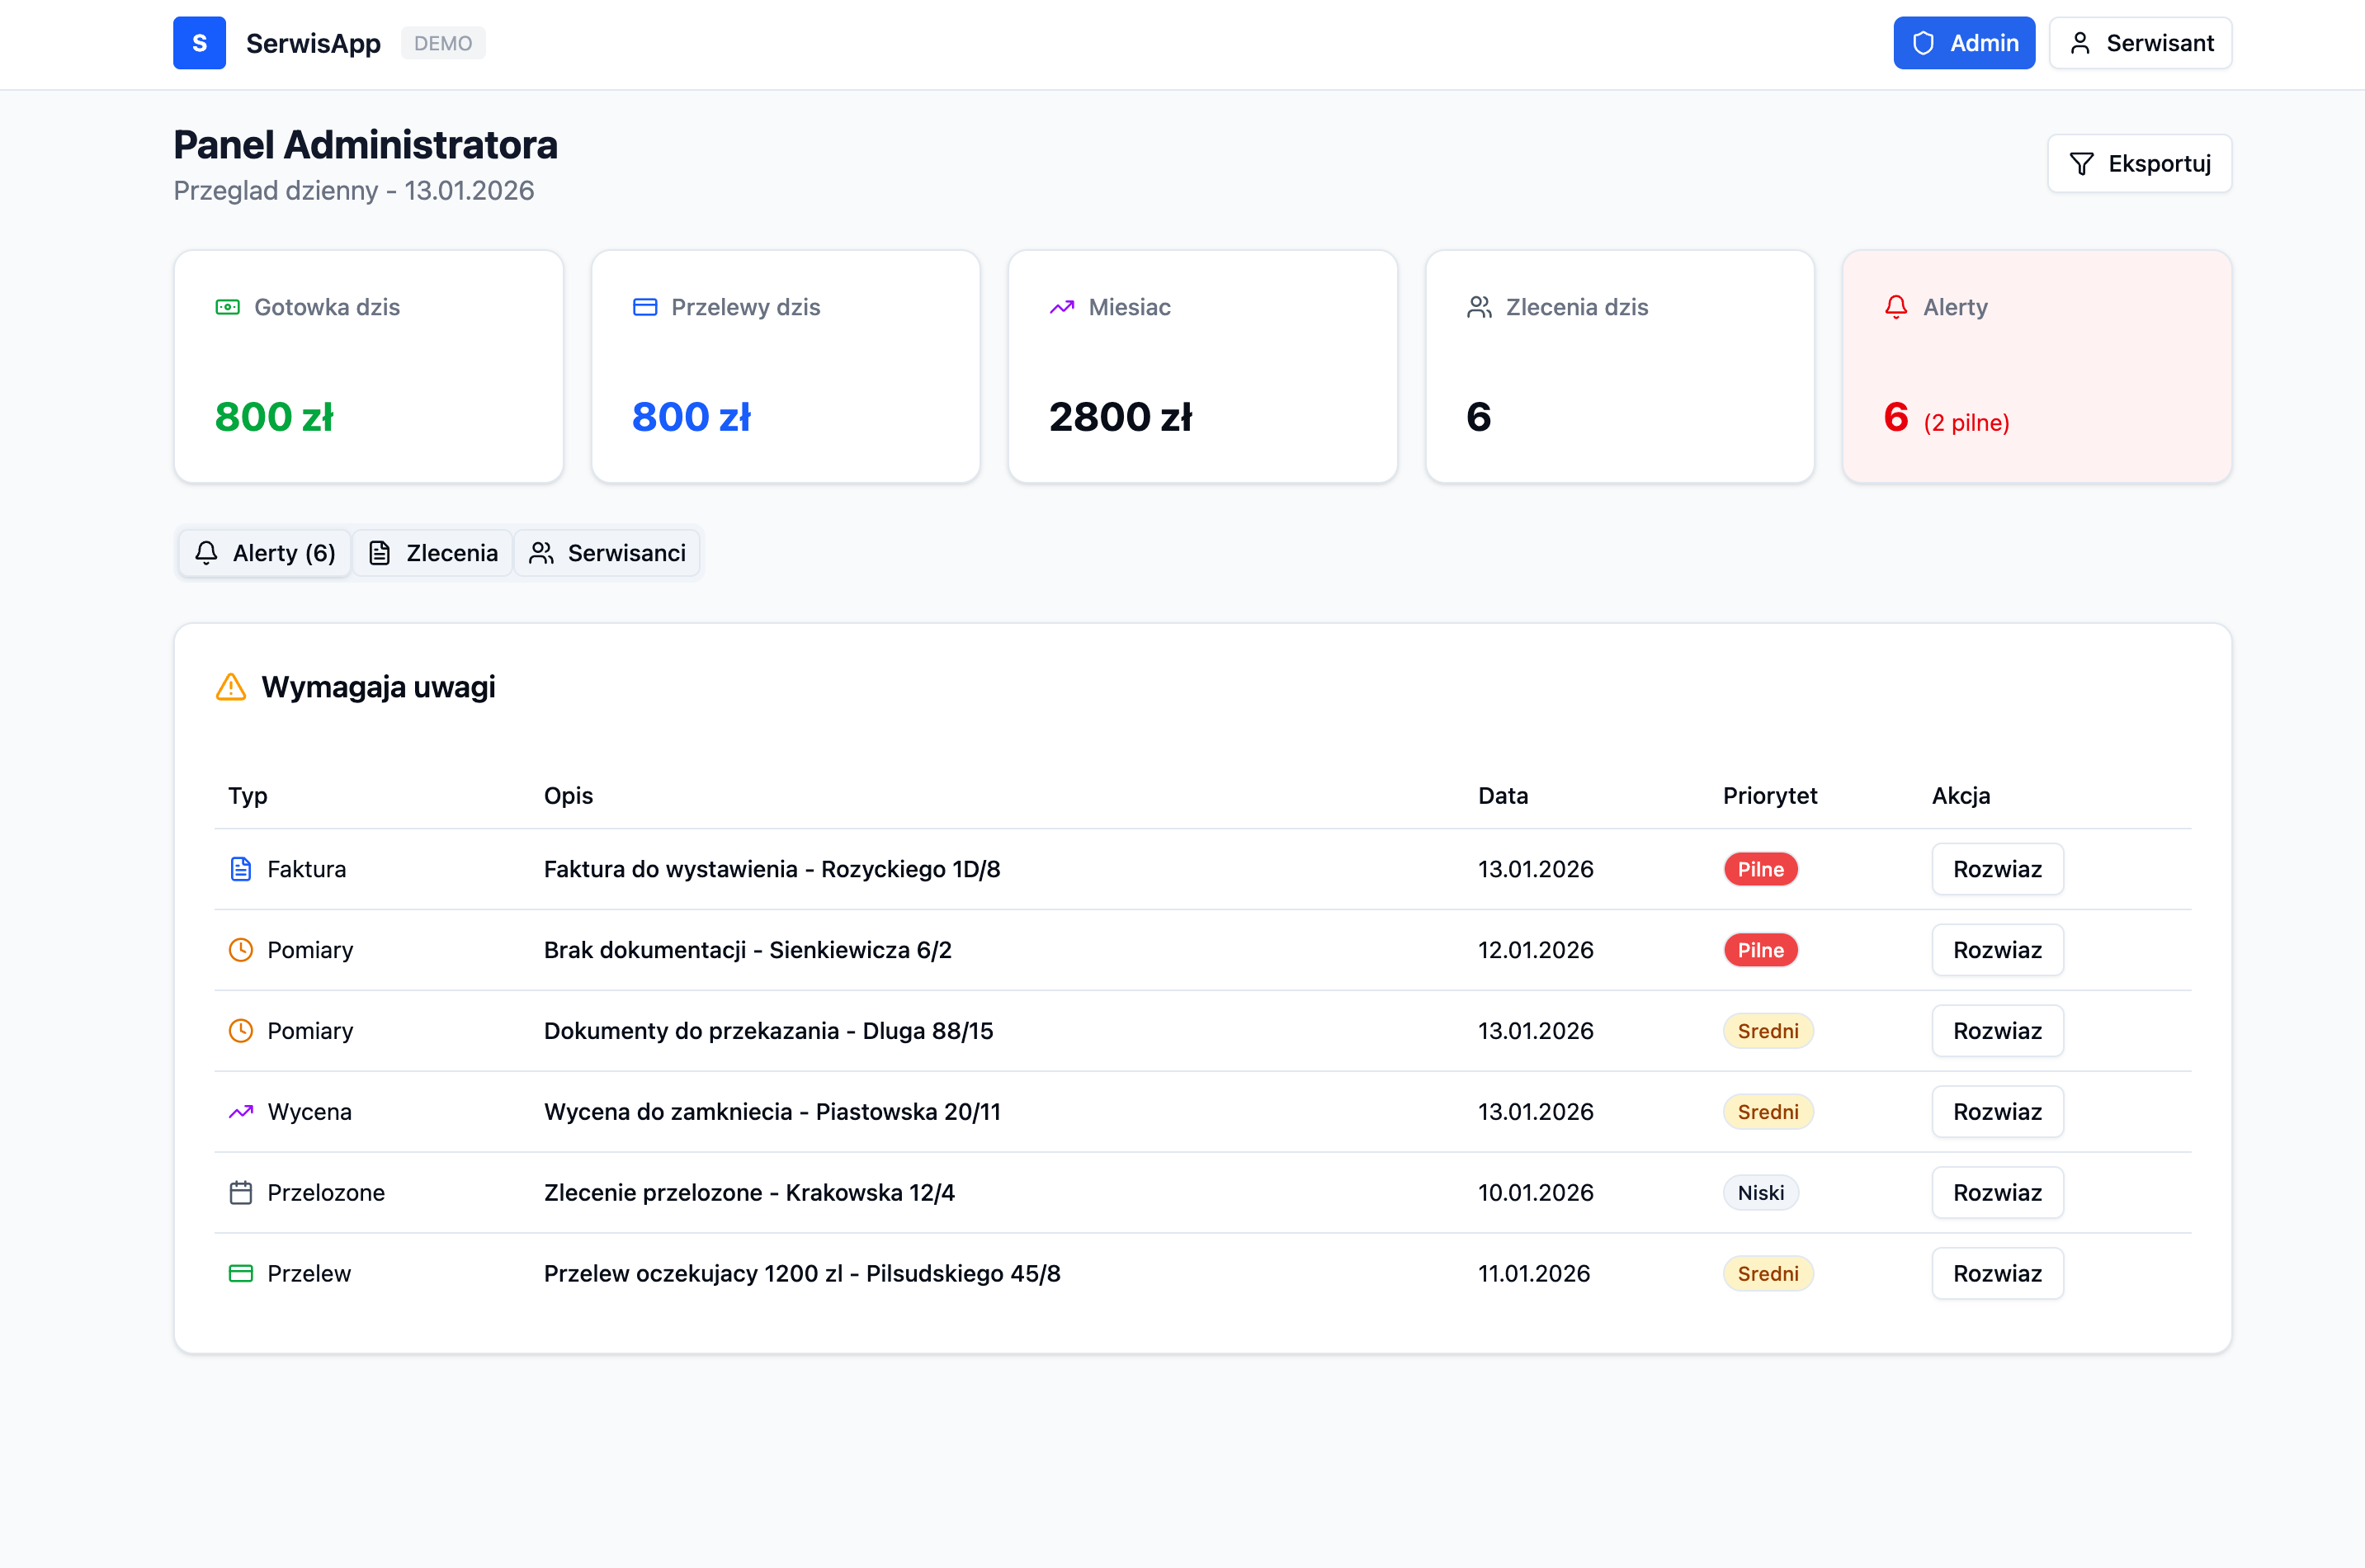
The first level is the owner’s view. It shows daily revenue split between cash and bank transfers, the number of work orders, a prioritized list of all jobs, and alerts about missing documents. One screen answers the question: how is the business doing today?
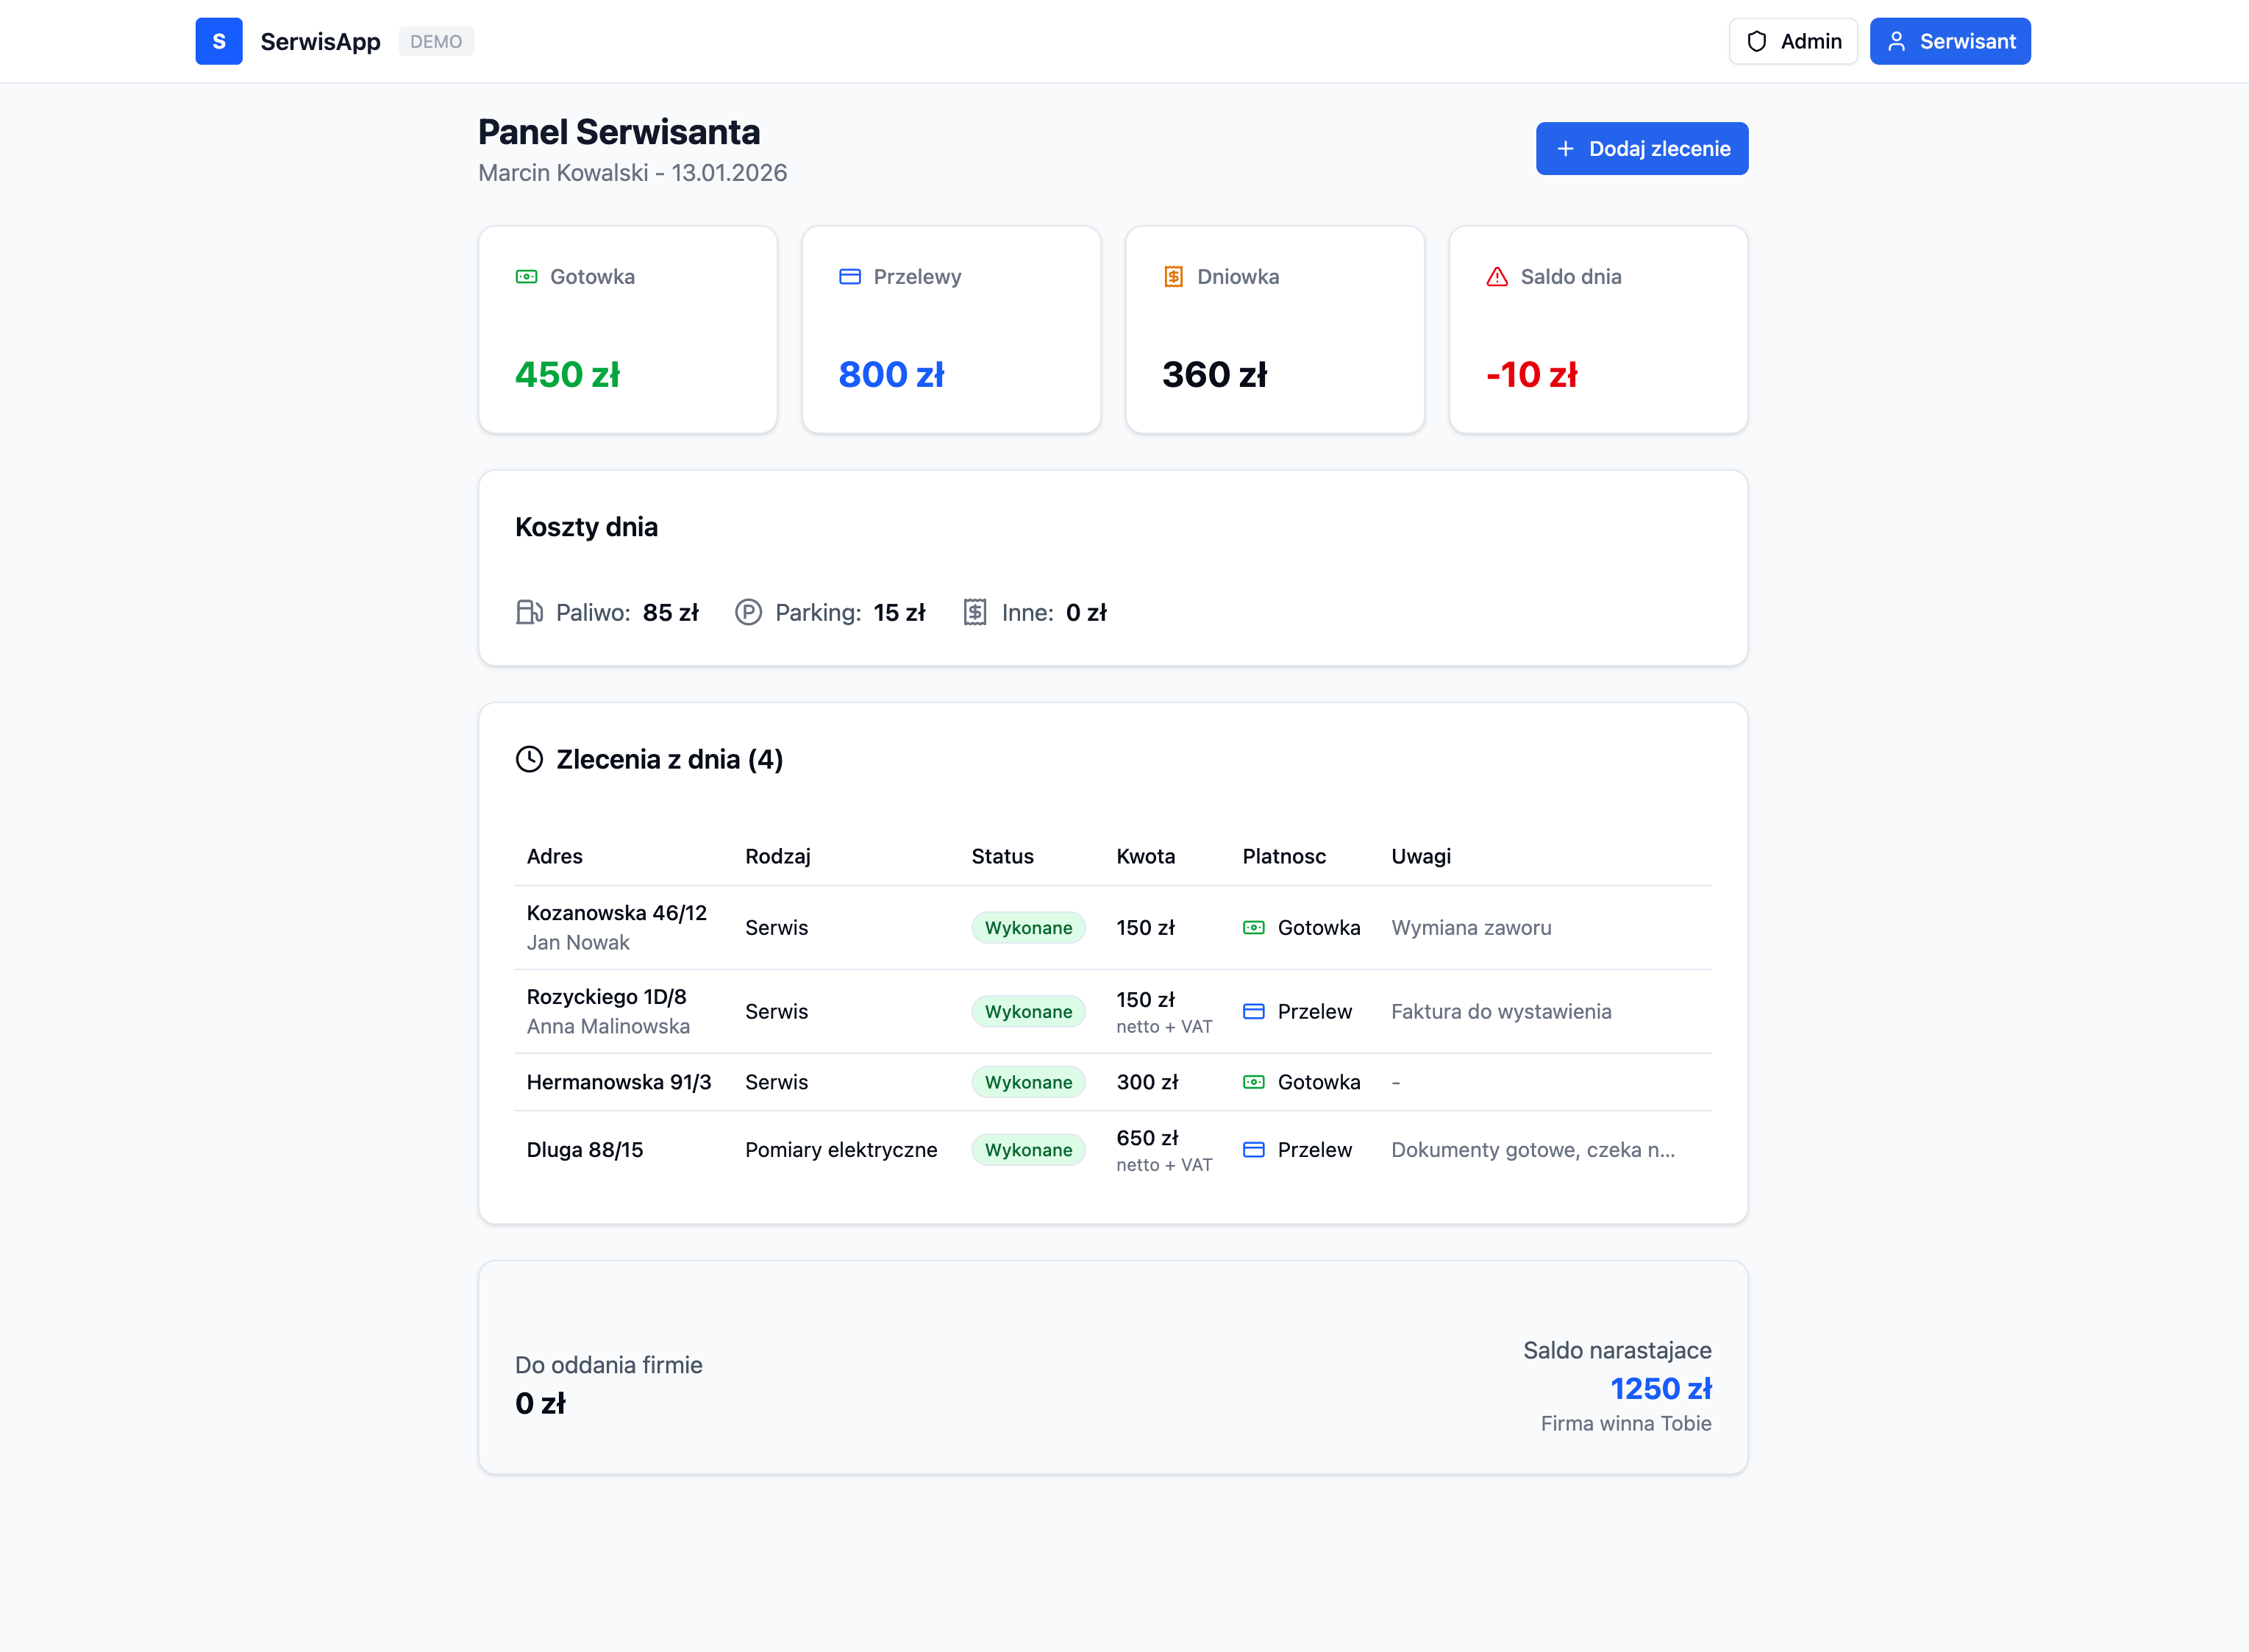
The second level is the technician dashboard. Every technician has their own view, with today’s jobs, addresses, and amounts. They record how each customer paid, add fuel and parking costs, and see their running balance with the company. That last point is essential: both the technician and the office see the same number, so there is nothing to dispute.
Behind the dashboards is settlement logic that calculates balances automatically, tracks job statuses, and sends alerts when an invoice or document is missing. We also added CSV exports, monthly reports, and accounting summaries so month-end does not mean entering everything all over again.
How it works today
Implementation took two weeks. The first three days went into breaking down the process and designing both dashboards. The following week covered development, settlement logic, and alerts. The final four days were for testing with real data, moving the information from Excel, and training the team.
Technicians now close a job on their phones and enter the payment and expenses; the balance is recalculated immediately. The owner can see current revenue for the day and which documents are missing. Accounting summaries come from the dashboard rather than a spreadsheet.
The outcome
Settlements are now calculated fully automatically, with no manual Excel work. More than ten technicians have their own account dashboards. Job statuses and revenue are visible in real time. Alerts for missing documents and invoices are sent automatically.
What we would do differently
We started moving data out of Excel too late. The spreadsheets the company had maintained for years contained their own abbreviations, notes, and exceptions, and untangling them took longer than building some of the modules. Next time, we will review that data at the start, not leave it until the end.
The second lesson concerns the technician dashboard. We designed it first for a desktop browser, but it is used mostly on a phone, in a vehicle, often in a hurry. The small-screen view should have been our starting point. The third lesson is less technical: when a tool calculates people’s pay, it is worth talking to technicians from day one, not only to the owner.
Related projects
One dashboard instead of five open tabs at an agency
A marketing agency got a single view bringing together client budgets, payments, and overdue balances alongside deals and projects.
China imports on one map, with customs documents alongside them
A logistics company can see every container in transit on one map, while the system flags missing documents before customs clearance.