China imports on one map, with customs documents alongside them
A logistics company can see every container in transit on one map, while the system flags missing documents before customs clearance.
3 min read
- Client
- Logistics company
- Industry
- Logistics / Import
- Scope
- Custom systems and API integrations
- Delivery time
- 10 days
Who the client was and what was getting in the way
A logistics company importing goods from China. At any given time, dozens of active shipments are in transit, each with a different supplier, carrier, and set of documents. Sea freight takes weeks, so a planning mistake may only become visible a month later, when it is too late to fix anything.
Information about these shipments was spread across several places. Orders were in spreadsheets, supplier arrangements in email, shipment statuses on carriers’ websites, and customs documents in folders. Finding the physical location of one container meant logging into three or four carrier systems and copying tracking numbers by hand. Doing that once a day for dozens of imports took half a full-time employee’s time.
This led to tangible problems. Missing customs documents were discovered only during clearance, when every day in port costs money. No one could say when an order would reach the warehouse, so inventory and promotion planning was guesswork. Contact with more than ten suppliers in China happened by email, with no mechanism to flag production delays before they became a problem.
Off-the-shelf freight systems were ruled out for one reason: the company uses Subiekt GT as its source of truth for inventory. A tool that tracks containers but cannot update Subiekt after clearance would only move manual data entry somewhere else. That is why we built a dashboard designed from the outset to work with this system.
What we built
We built Logistics Hub with Next.js 14 and TypeScript, storing data in Supabase. It has four parts.
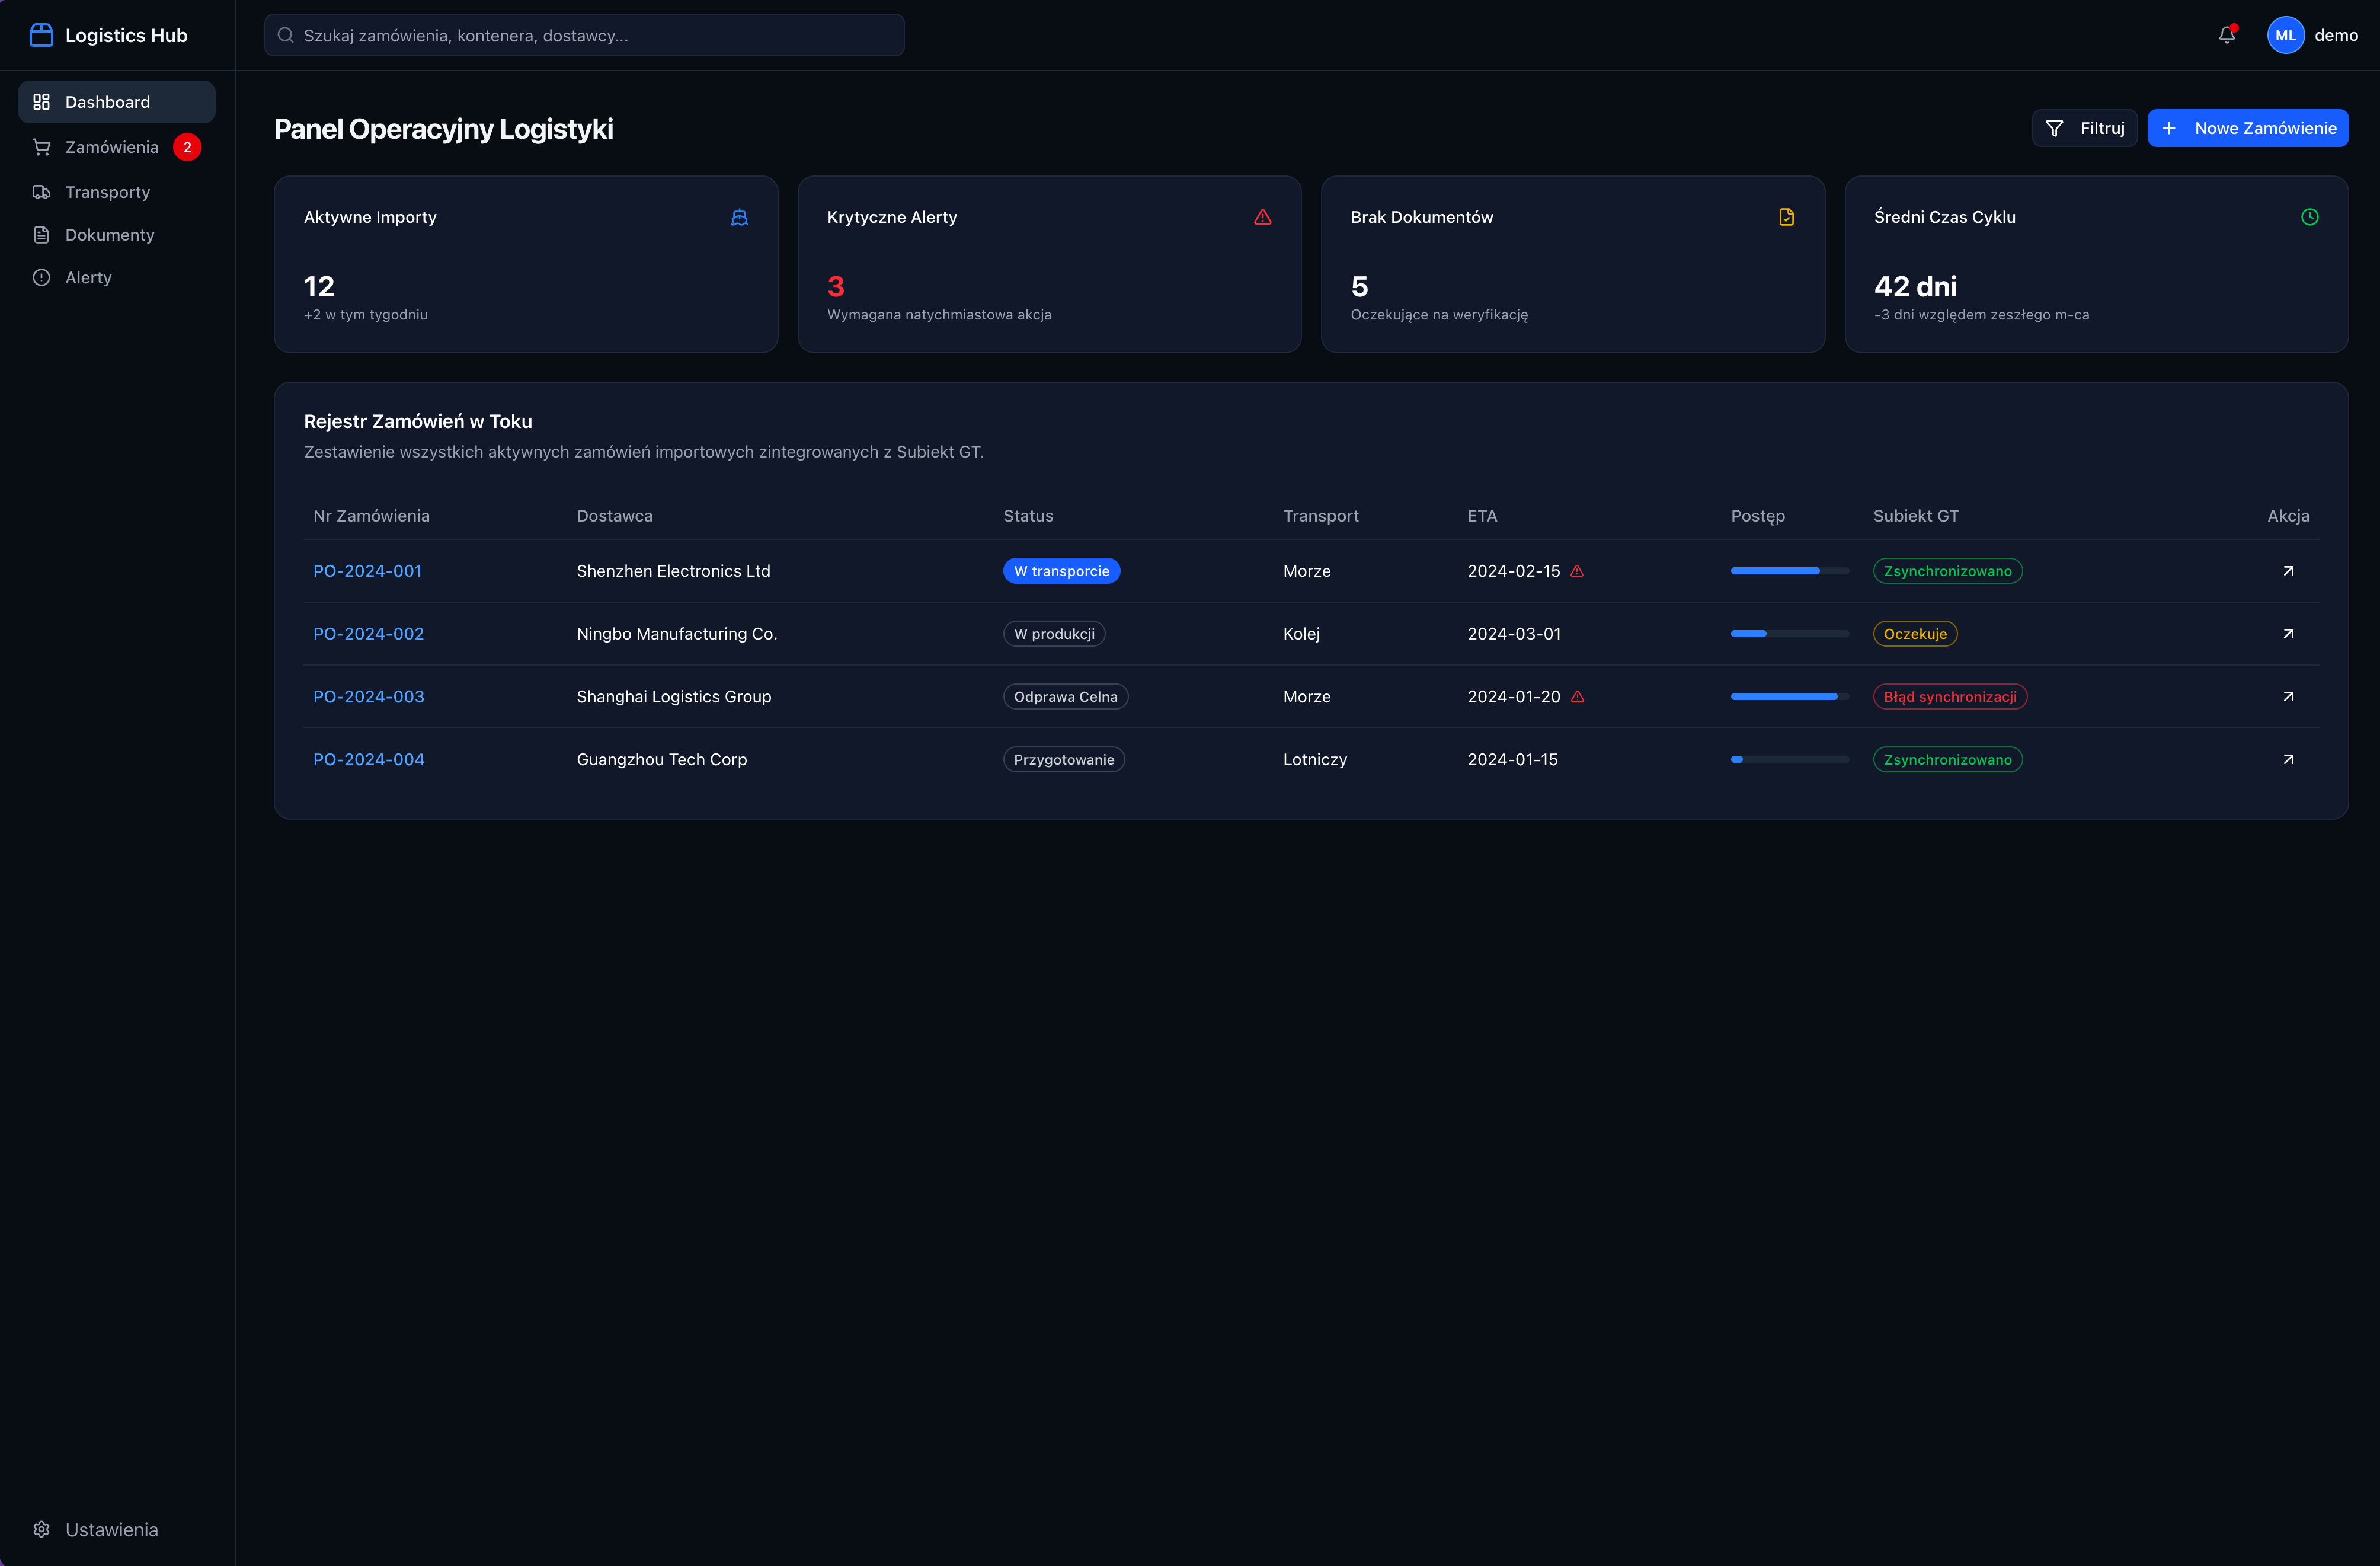
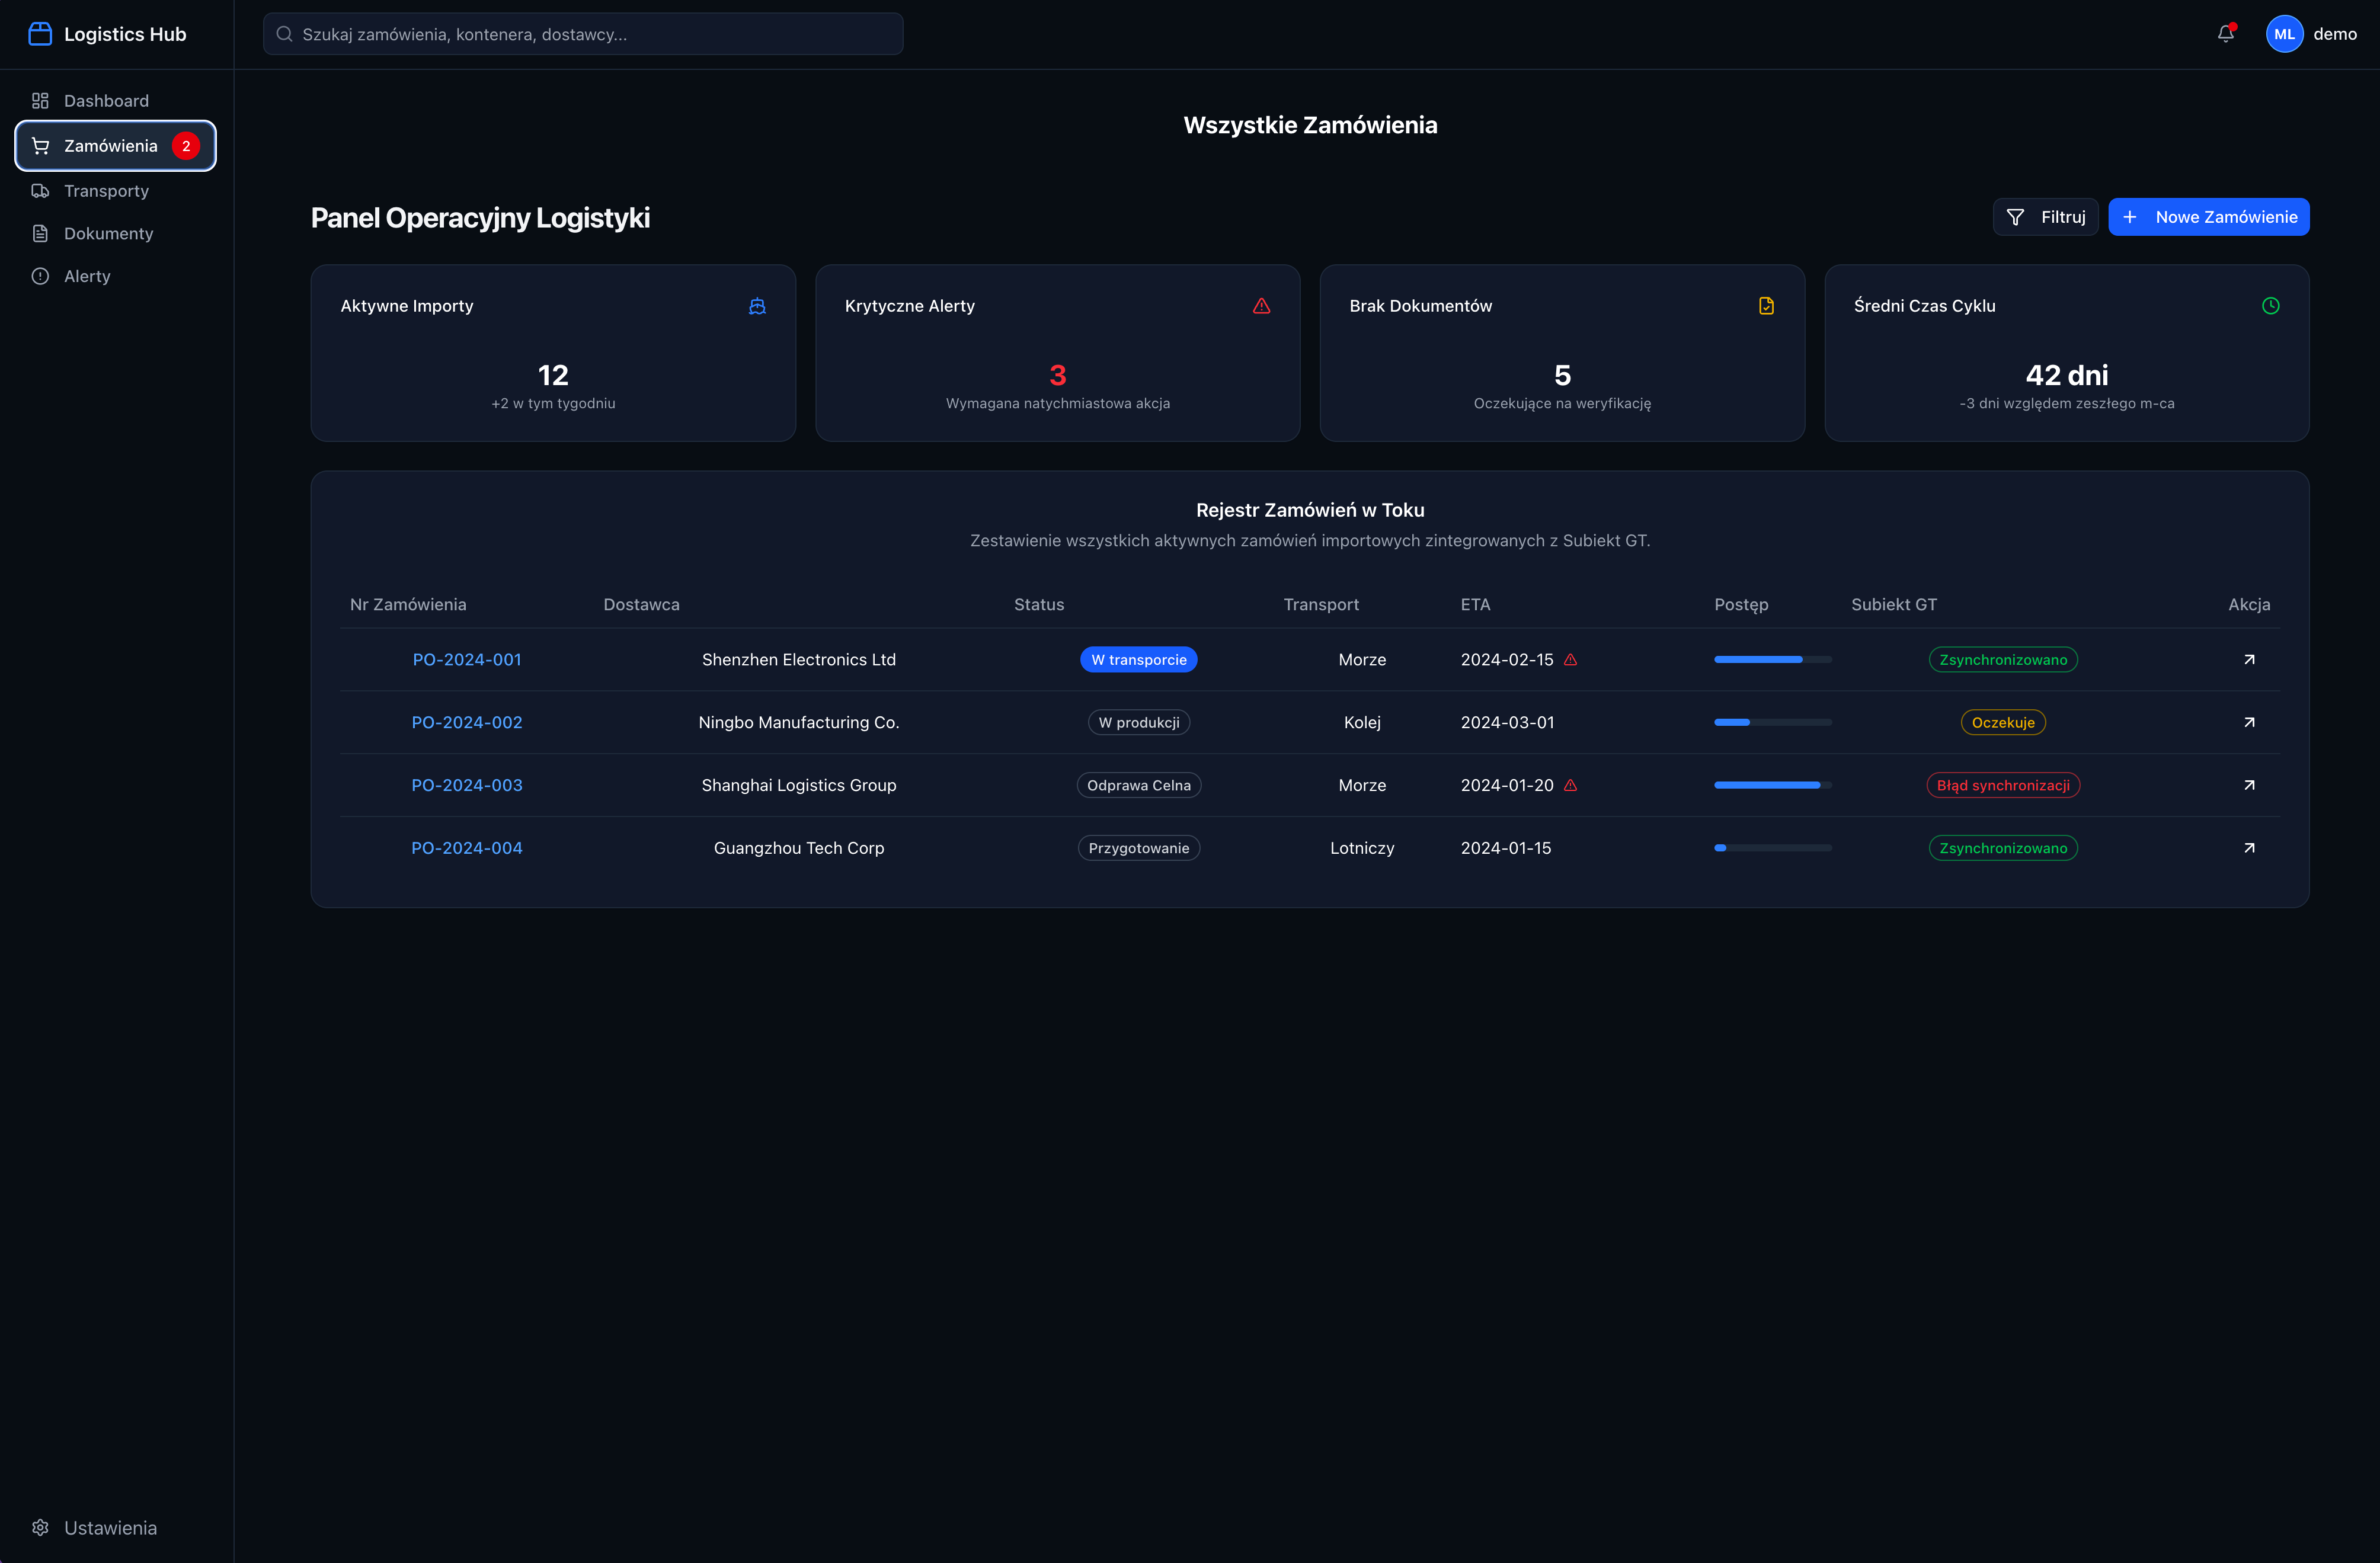
The first is an operations dashboard with key figures: active imports, alerts, missing documents, and average delivery time. Alongside it is a register of every order, with its supplier, status, amounts, and documentation — information that used to be scattered across spreadsheets.
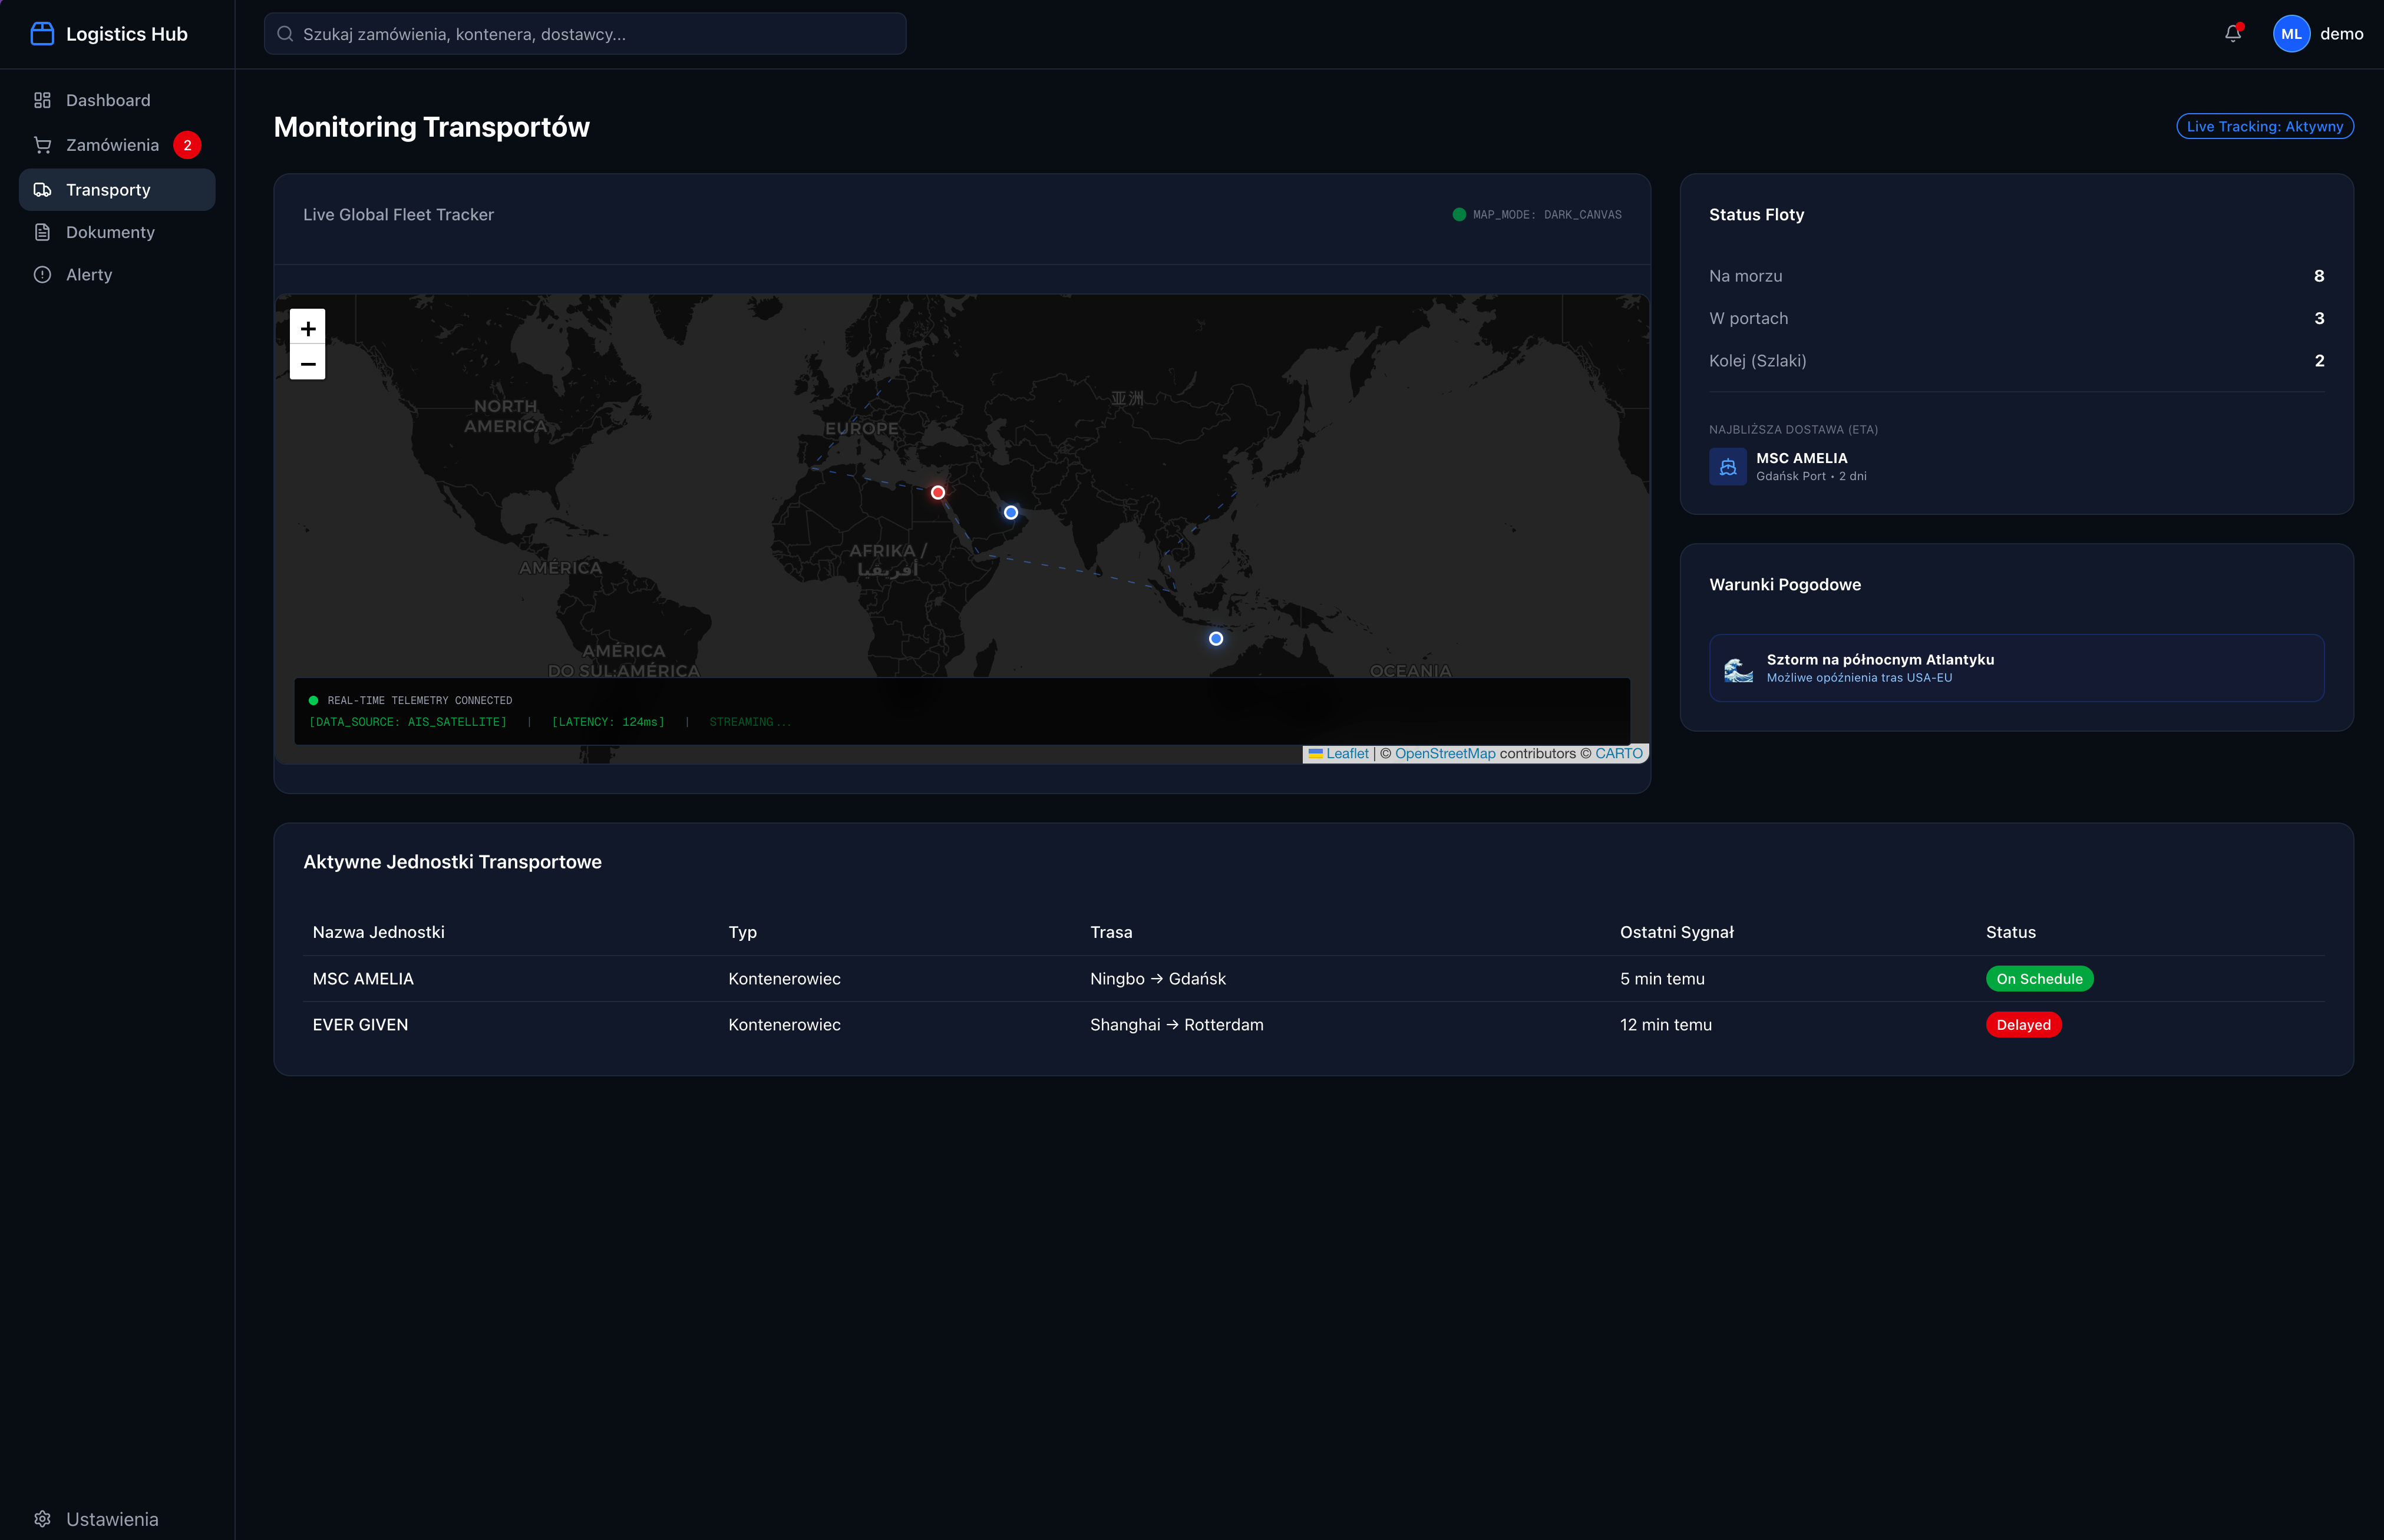
The second is a transport map. We connected to ocean carriers’ interfaces to retrieve container locations and built the map with Leaflet. It shows routes from China to Poland and the estimated arrival time for each shipment. Instead of logging into four systems, the team uses one screen.
The third part handles customs documents. Invoices, certificates, and declarations are stored with the relevant import. The system checks what is missing and raises an alert before the clearance date, not during clearance.
The fourth is the connection to Subiekt GT. After customs clearance, inventory updates automatically and the data flows on to accounting. Warehouse stock and imports therefore stay in sync.
How it works today
The whole solution was built in ten days. The first two went into mapping the import process, suppliers, and carriers, and designing the dashboard and map. The next five covered the operations dashboard, order register, carrier connections, map, and document module. The final three were for connecting Subiekt GT, setting up alerts, testing with real imports, and training the team.
The team now starts the day with the map and its alert list. Container locations refresh automatically instead of being checked by hand. Missing clearance documents are flagged in advance. After clearance, inventory reaches Subiekt without anyone re-entering it.
The outcome
Ocean shipments are tracked in real time on one map. Orders from more than ten Chinese suppliers are managed in one place. Alerts for missing documents and delays are automatic. Data syncs with Subiekt GT, keeping warehouse records consistent with what has actually arrived.
What we would do differently
Carrier data turned out to be the weakest point. It can be delayed, incomplete, or simply different across two sources for the same container. We built the map before deciding what to do when sources disagreed, which was the wrong order. Next time, we will set a source-priority rule first and clearly show when a location is estimated rather than confirmed.
The second lesson concerns Subiekt GT. Its integration came at the end, even though it determined whether the dashboard was truly useful. It should have been the first step, not the last. The third concerns document alerts: we set the timing thresholds by instinct, and only real use showed us how many days before clearance the warning should appear.
Related projects
One dashboard instead of five open tabs at an agency
A marketing agency got a single view bringing together client budgets, payments, and overdue balances alongside deals and projects.
A dashboard that settles technicians’ accounts instead of an Excel spreadsheet
A field-service company with more than ten technicians stopped tallying cash, fuel, and parking by hand. Balances are calculated automatically.